Where is your company's spare-parts warehouse? Most likely in the same building as head office.
Our seven plants were the same: Hangzhou, Chengdu, Xiamen — and the warehouse in Hangzhou. It had been sitting in that city for years and nobody had ever asked whether it should move.
Then I typed it into Excel: seven rows of coordinates, seven consumption figures. I assumed the point the calculation produced would be the cheapest one. It came out 19% more expensive than Hangzhou.
But after the calculation I changed three things. This post is about those three things.
Start with the scene.
One of the etchers at the Xiamen plant stopped, waiting for a quartz part.
Quartz parts on an etcher are consumables; they wear out and get replaced. This one was in the central warehouse six hundred-odd kilometres away, resting quietly on a shelf. It was not missing. It was not broken. It was simply not where it needed to be.
Rush it over and it takes at least a dozen hours. But a production etcher standing still is losing money by the hour — this is not a freight bill, it is a downtime bill.
At the time I was in supply chain at a semiconductor manufacturer, and I was involved in spare-parts purchasing for the seven plants. I was involved in deciding where the central warehouse went. I never calculated it.
Why not? Because back then nobody thought it was a question you could calculate. One sentence was enough: the warehouse follows the management team. The management team is in the head-office city, so the warehouse is in that city.
The reasoning is not absurd. It had just never been tested.
In 2021 the whole industry was fighting for equipment and material, and this landed on my desk.
What I remember most about that year is the quartz parts — an unglamorous consumable on the tool, and the most painful class of material there is.
A 12-inch quartz tube was quoted publicly at about 19,500 yuan each. And its life varies enormously: one to two years in diffusion and oxidation processes, only three to six months under CVD, and some quartz instruments have to be replaced in ten days to three months. Imported quartz raw material takes three to six months to restock.
Expensive, consumed fast, and unavailable. A 19,500-yuan item written off in as little as ten days, and half a year's lead time to replace it.
And it was not only quartz parts. That year the lead time on semiconductor equipment worldwide went from three to six months before the pandemic, first to twelve to eighteen months, then to eighteen to thirty months. Fabs had the money and still could not get the tools. The expansion plans at TSMC, UMC, SMIC and GlobalFoundries slipped two to nine months overall. Global foundry capacity growth for 2023 was pulled down from an expected 10% to 8%.
Capacity was not blocked by money. It was blocked by time.
That was the moment it hit me: where a spare-parts warehouse sits was never a freight question.
So I opened Excel.
Put the seven plants on a flat map: one coordinate across, one coordinate up. How much spare-parts value each plant burns in a year is its weight — the plant that consumes more has a louder voice.
Then find a "weighted average position": take the position of every plant, weight it by its own consumption, and average. That is the centre-of-gravity method, one of the standard siting algorithms in the industry. The whole algorithm is one sentence: coordinate times consumption, add it all up, divide by the total consumption.
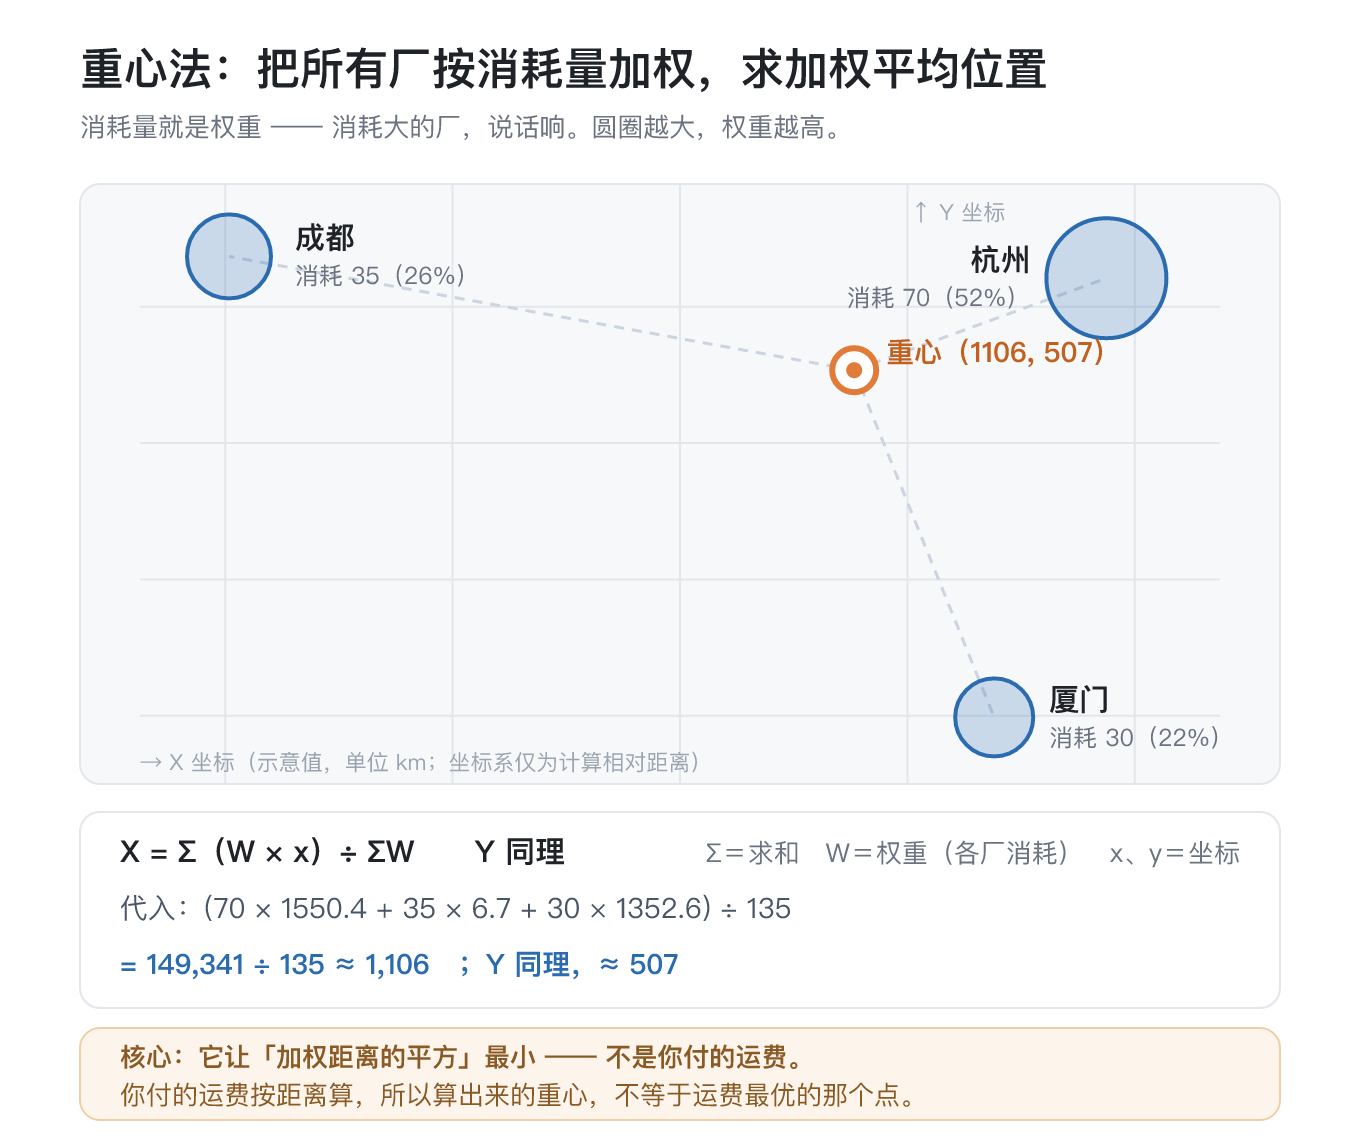
Merged by city, the seven plants weigh like this: Hangzhou 70, Chengdu 35, Xiamen 30, total 135 — the weights being annual spare-parts consumption in units of 10,000 yuan. The centre of gravity lands at 1106, 507, pulled west by the two Chengdu plants.
The coordinates, consumption figures and travel times below are illustrative, there only to make the method clear. Put your own numbers in and the direction does not change.
The first thing is what a warehouse's location should follow.
At this point I, like everyone else, thought the answer was settled: move the warehouse to the centre of gravity and the freight is lowest.
Then the first line the model gave me stopped me cold.
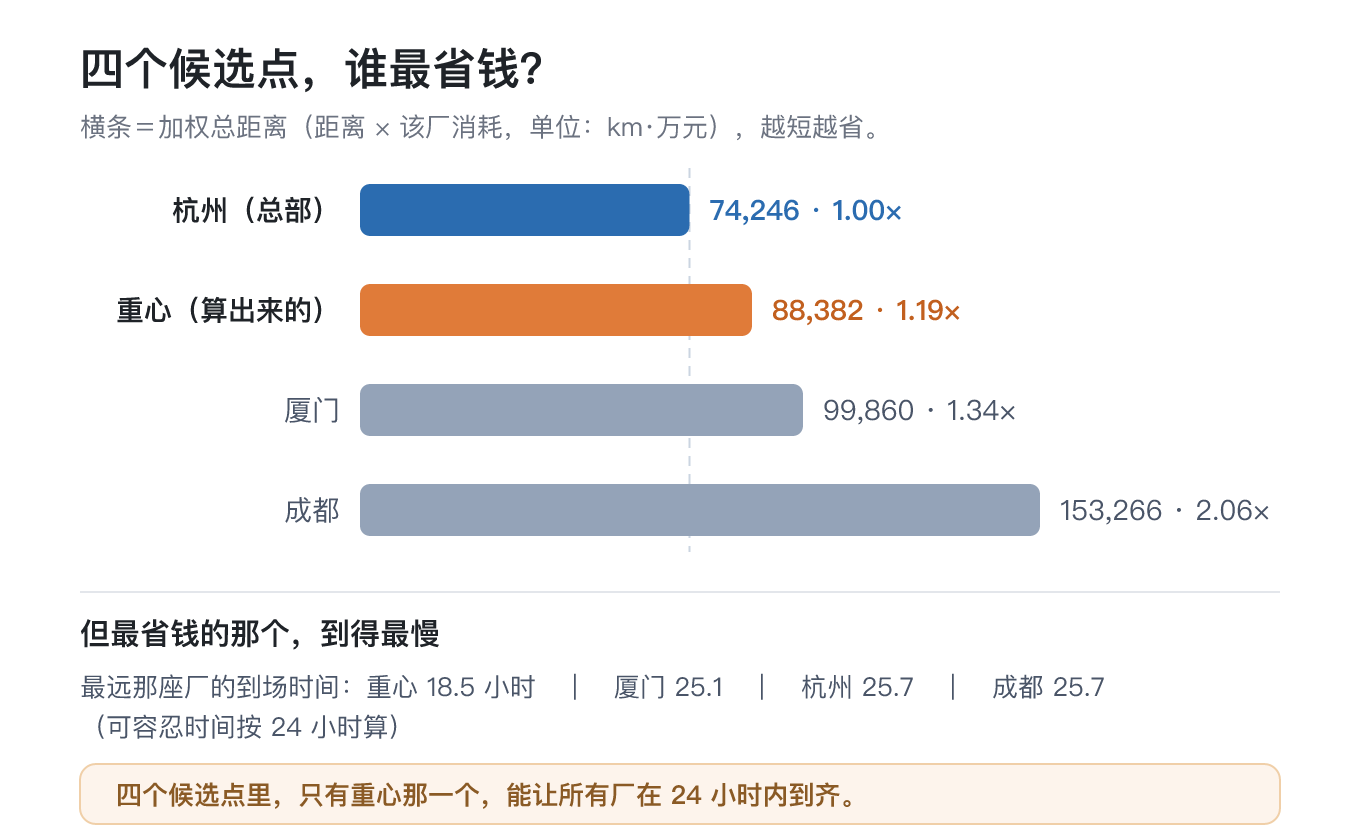
The weighted total distance at the centre of gravity is 88,382, against 74,246 for Hangzhou — the centre of gravity is 19% more expensive.
Where does that number come from? One rule: for each plant, the distance to it times that plant's annual consumption, all added up.
Run it for Hangzhou: 1,544 km to Chengdu, times Chengdu's weight of 35, is 54,000. To Xiamen, 674 km times 30, is 20,000. To itself, zero. The three add up to 74,246.
Put the centre of gravity in instead and run the same rule: the Hangzhou term 32,000, the Chengdu term 39,000, the Xiamen term 17,000 — 88,382.
The point I had spent all that time calculating was not the cheapest on freight.
Why? Because what the centre-of-gravity method minimises is the square of weighted distance, not the freight you pay. You pay freight by distance; the model picks a point by distance squared. The two only coincide when every plant is stacked on one point. Spread the plants out and they part company.
An objective function and an algorithm are never the same thing. When someone hands you an "optimal solution", ask first: optimal with respect to what?
So why is Hangzhou cheapest?
Because Hangzhou accounts for more than half of total consumption. And Hangzhou's distance to itself is zero. The city that consumes the most carries a built-in "zero-distance" dividend.
So the model went all the way round and produced a freight-optimal answer of "put it where consumption is biggest" — which is head office. The same conclusion as the original guess, exactly.
But the two "sames" are not the same thing.
The guess did not know. A calculation knows, and still chooses this. The risk in the first is this: if the plant locations or the consumption mix change, you will not feel a thing, because your basis was never the numbers. The value of the second is this: you know what the conclusion rests on — it rests on the premise that consumption is highly concentrated. Change the premise and the answer flips at once.
So where did your warehouse network come from?
If it followed the management team, followed history, followed some particular relocation, then it grew. If it follows a consumption distribution you recalculate every year, then it was calculated.
What grew is not necessarily wrong. But you need to know that it grew.
The second thing is time. And this time it is not just the Xiamen plant to look at — it is all seven.
Look back first at that chart of four candidate sites. Underneath it there is a line of small print: the cheapest one arrives last.
Read that sentence twice. It is not saying "the cheapest one cannot be used". It is saying — the same chart has two winners.
Compare money: Hangzhou 74,246 (1.00×), centre of gravity 88,382 (1.19×). Hangzhou wins.
Compare time: the centre of gravity reaches the farthest plant in 18.5 hours; Hangzhou takes 25.7 hours and Xiamen 25.1 — the centre of gravity is more than seven hours faster.
Both winners come out of the same thing — the "distance squared" of the previous section. It punishes the far end hardest, so what it watches is not the total bill but the worst single case. And the second question a warehouse network has to answer is exactly that one: can the farthest plant be served in time?
Of the four candidate sites, only this one lets every plant be reached within 24 hours.
So the centre of gravity is not the point that was calculated wrong. It is the right answer to a different question.
Freight pulls you to one place; time demands that you sit in the middle. Two constraints, pointing at two different points.
In that situation the worst answer is "so where do we put it". Because whichever one you choose, you have sacrificed the other.
At this point, do not choose a point. Layer it.
Keep the central warehouse where freight is optimal — it handles the high-volume, common, can-wait items. As for where the emergency mini-store goes, do not rush to site it by "which plant is farthest".
The two farthest plants are packaging plants, and they do not use quartz parts. The plant that really uses them — and uses them fast — is Xiamen. So the mini-store belongs in Xiamen. What decides where it goes is "which plant uses items that cannot wait", not "which plant is farthest".
What goes in the emergency mini-store? That is the third thing.
Not "important parts". Not "expensive parts". Parts where all three conditions hold at once:
High unit price, long lead time, and a stoppage if it runs out.
Miss one and it does not deserve a shelf position of its own: high price but available everywhere, ordered today and arriving tomorrow — the central warehouse is enough.
Back to the quartz parts: 19,500 each, imported raw material three to six months to restock, and the short-life batch needs replacing in ten days to three months.
All three.
So across seven plants and three cities, the number of categories that genuinely belong in that emergency mini-store long-term is not large. It does not solve freight. It solves "cannot wait".
To close, three questions for you to answer yourself.
The place your central warehouse sits today — was it calculated, or did it grow?
Which plant uses items that cannot wait? How long does it take to move one item from the central warehouse to that plant?
Out of your shelf positions, how many items genuinely satisfy "expensive, slow, stops the line"?
Answer those three and you will roughly know where that money should be spent.
If you cannot answer them, that is fine too. I have tidied up the calculation sheet I used: put in your own plants, coordinates and consumption, and it will tell you where the centre of gravity is, which candidate site is cheapest, and how many hours it takes to reach the farthest plant.
This time I stepped into another pit: treating the point the formula produced as the cheapest point. Twenty-four years in, I have stepped in plenty of pits ahead of you. We will fill them in one at a time.
The sheet can tell you which point is cheapest. It cannot tell you how long that answer will hold. Next time I will fill in that step.
Data sources
- Quartz part unit price, service life and restocking lead time: Kaide Quartz prospectus and first-round inquiry response, publicly disclosed December 2021
- Semiconductor equipment lead times and foundry expansion slippage: TrendForce, 2022, as cited by the Economic Daily News and China Economic Net
- Global market size for quartz fabricated parts: TECHCET, cited in EE Times China
The coordinates, consumption weights, travel speeds and tolerable times in the siting model above are illustrative teaching values used to demonstrate the method. Replace them with your own plant data and recalculate.
A note on why "weighted average" is "minimum squared distance"
The point the centre-of-gravity method looks for can be written in one sentence: make "the squared distance to each plant, weighted by that plant's consumption and added up" as small as possible.
The square has one virtue: it separates the two axes, which stop interacting, so each can be extremised on its own; and the result is exactly "the coordinates weighted by consumption and averaged". So the weighted average is not an algorithm someone picked out of the air. It is the unique answer to that "minimum squared distance" objective — unique, with no two points tying for best.
Why not use distance itself, then? Because "minimum sum of squared distances" can be solved in one step and has a unique solution, whereas "minimum sum of distances" has an optimal set that is a whole interval, no longer unique, and can only be approached by a computer step by step. The cost of squaring is that it punishes very distant points hardest — which is exactly why the centre of gravity loses on freight and wins on time.