If you want it in one sentence: do not start by asking which model is the most advanced. Take your own historical sales data, back-test it, and choose the method with the lowest error inside your business structure — and the one that can afford to be wrong when the market changes.
How do you do it concretely? Cut the history into a genuine time order, fix a monthly re-estimation rule, and compare several methods with the same error yardstick. Below I do the whole thing on NIO's 44 months of published delivery data.
In 2019 NIO came close to delisting and William Li was called the unluckiest man of the year. Six years later, in 2025, the company delivered 326,000 vehicles — more than fifteen times that year.
That curve, doubling under a hail of criticism, is exactly what you want to test ten forecasting methods on.
I take NIO's 44 months of published delivery data and back-test ten methods one by one: which is accurate in which situation, how the error is calculated, and when they all fail together.
The rules: re-estimate monthly, and nobody gets to peek
The real skill in forecasting is not explaining yesterday. It is standing in today and guessing tomorrow.
With hindsight, everyone is a genius.
So the rules are fixed. 2023 and 2024 serve as the history textbook.
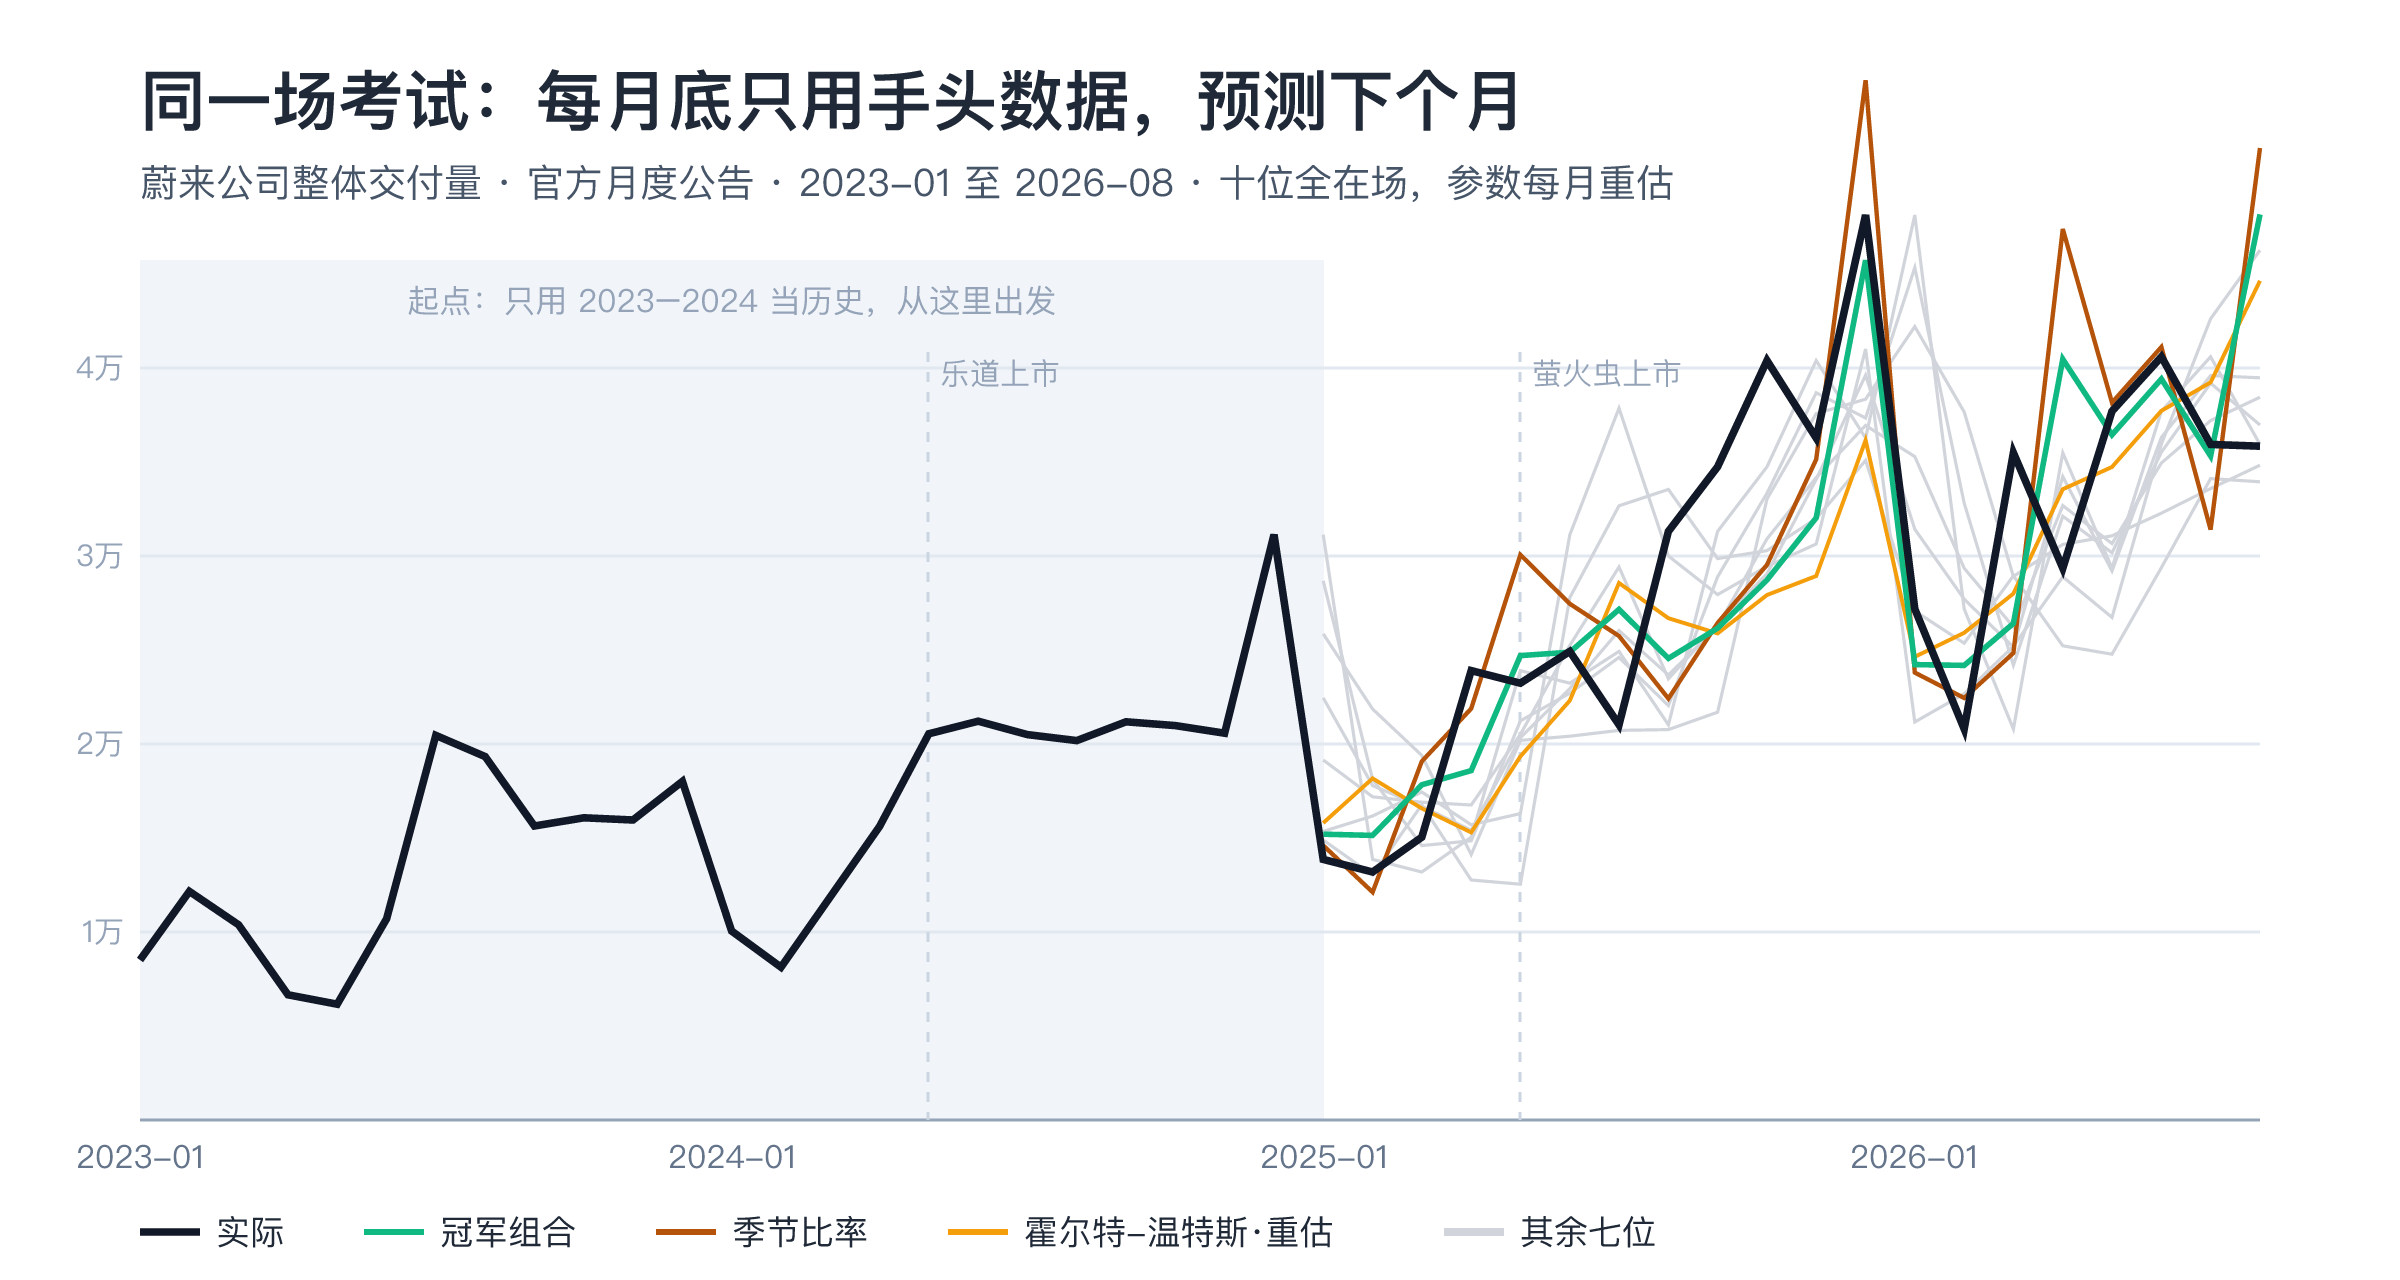
From January 2025, on the last day of each month, each of the ten contestants uses only what it has in hand to call the next month's number.
One more rule, aligned with reality: once the actual figure comes out each month, the parameters may be re-tuned — in the real world a planner recalibrates the model with new data every month. Methods with parameters re-estimate them; methods without parameters play by their definitions.
The next month comes, the answers are marked, and the score is kept. Twenty exams in a row.
Nobody gets to peek at the future — including me.
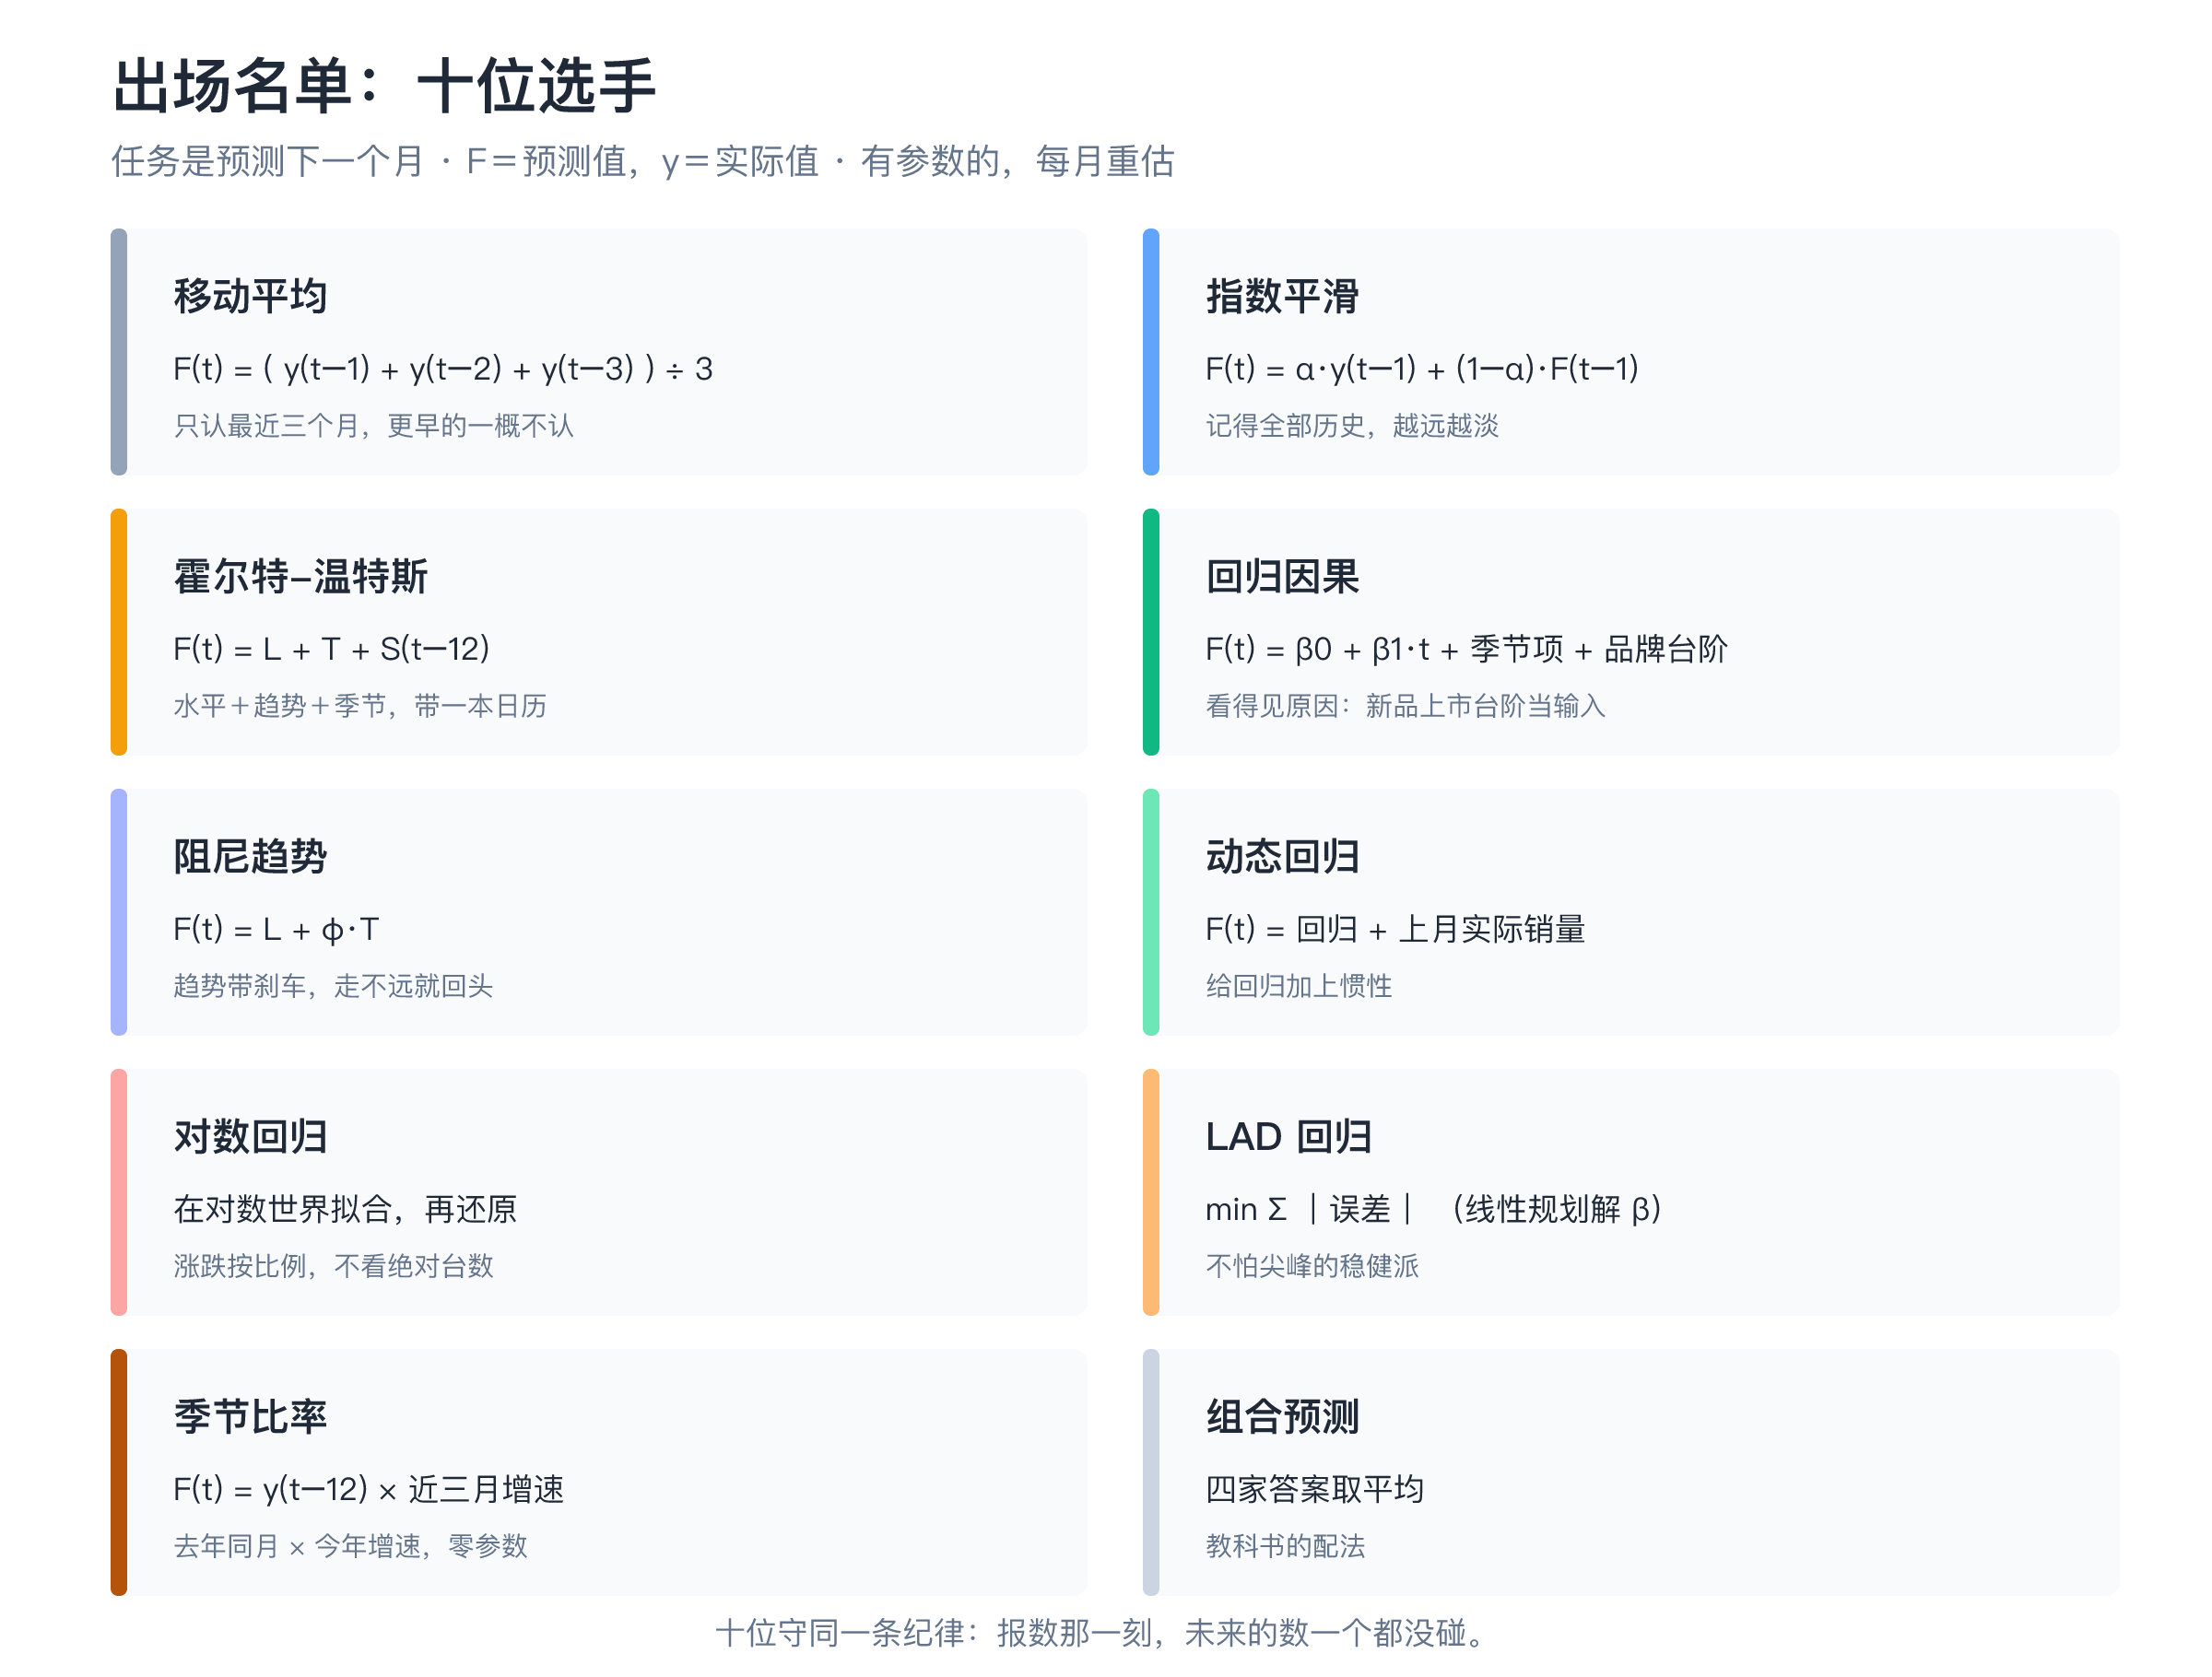
The line-up: ten contestants
The formulas are in the chart. The temperament is in the formulas.
The final score
All twenty rounds, none skipped. The yardstick is mean absolute percentage error: MAPE = (1/20)·Σ|F(t) − y(t)| ÷ y(t) — how far each month deviated from actual, averaged over twenty months.
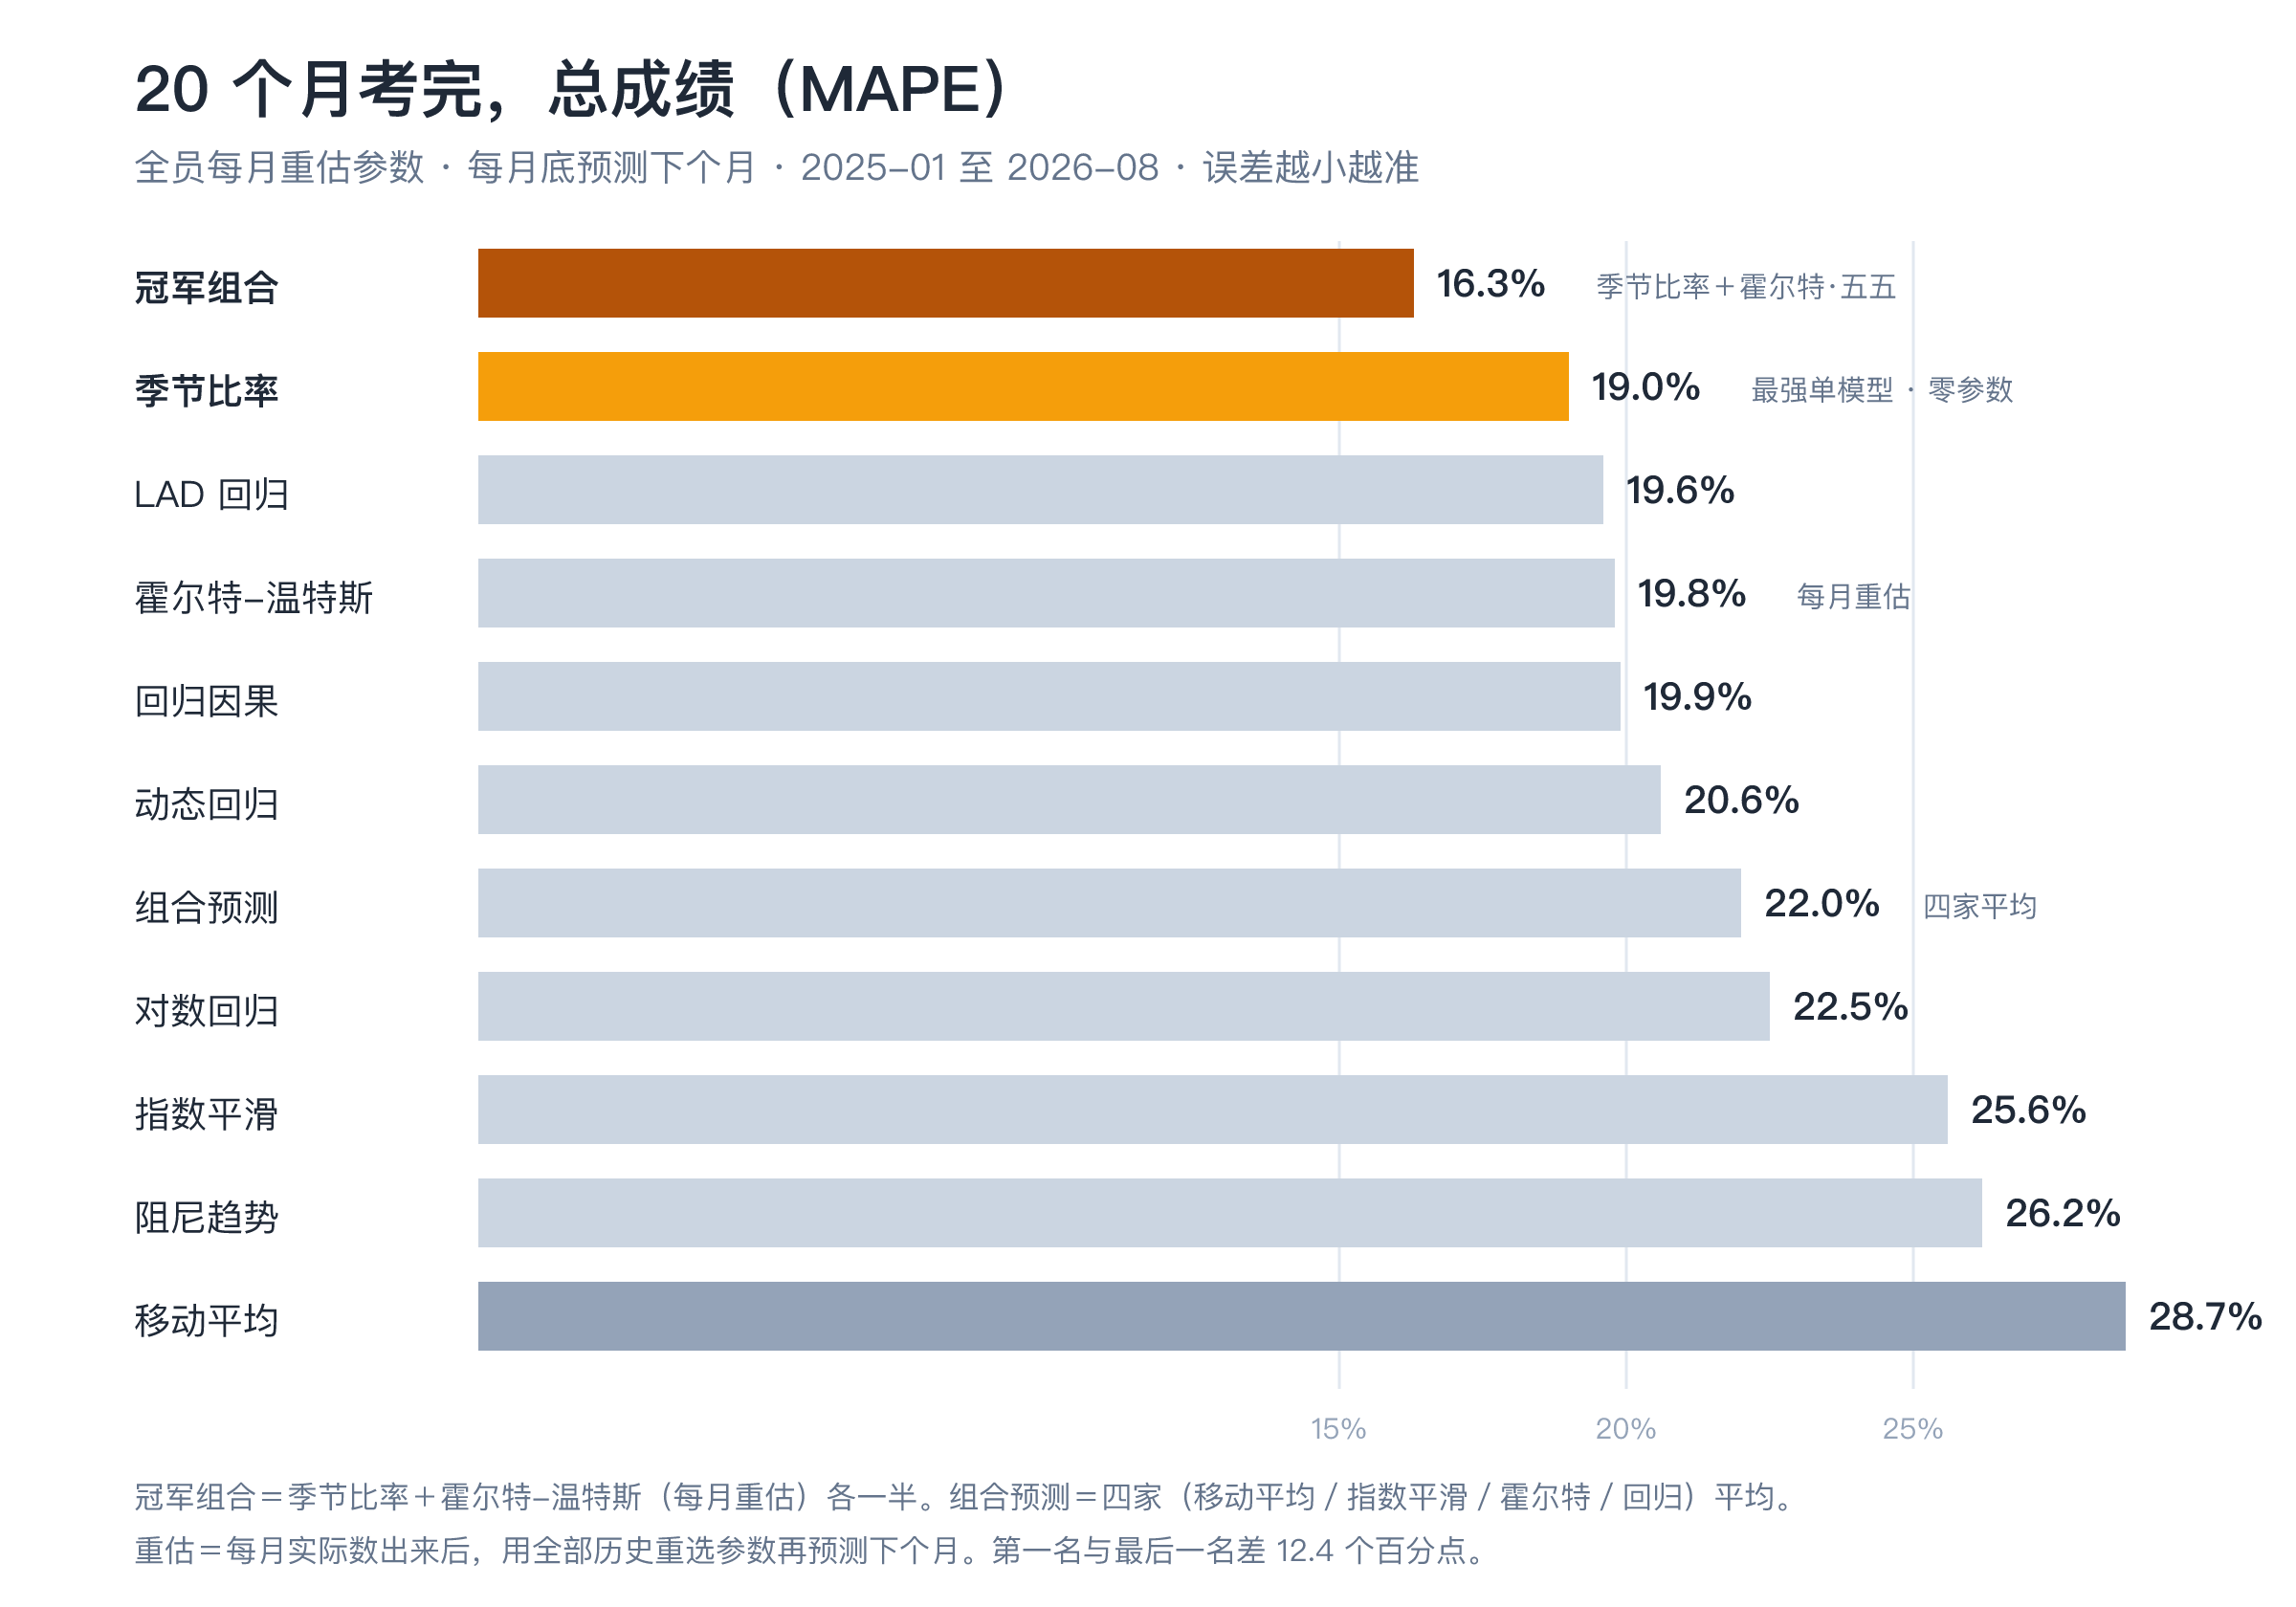
Top of the table is not a solo act: seasonal ratio plus Holt-Winters, averaged fifty-fifty, at 16.3%.
The strongest single model is seasonal ratio, 19.0%, with zero parameters.
It is strong on season. Everyone else's season is a shape fitted out of history; its season is the shape last year's twelve months actually ran. How deep February's trough is, it does not have to guess. It dug it last year.
But do not enshrine it. In February 2023 the month-on-month figure rose forty-three percent — January that year was a double trough of expiring subsidies and Spring Festival. A season is a statistical tendency, not a law of physics.
LAD regression 19.6%, Holt-Winters 19.8%, causal regression 19.9% — second to fourth crowded inside half a point.
The dumbest one, moving average, 28.7%, is 12.4 points off the winner. On a monthly average of thirty thousand vehicles, that is a judgement out by three thousand six hundred units every month. Choosing the wrong method is not a matter of style. It is a matter of money.
Why the winners won and the losers lost
First, why the combination wins. Seasonal ratio's strength is a real season; its weakness is that it treats the growth rate as fixed for three months. Holt-Winters re-estimates monthly and keeps up with change; its weakness is that its season is fitted. Their weaknesses do not overlap. Averaged fifty-fifty, each cancels out part of the other's error.
But averaging is not automatically useful. The combination that averaged four methods came in at 22.0%, below the middle — the strongest and the worst spooned into one pot, and the strong one's advantage diluted along with them.
The trick with combinations is one thing: find complementary ones. Do not simply pile them up.
Then re-estimation. Holt-Winters without re-estimation is 22.9%; with it, 19.8%. Its parameters describe the present level, the present trend, the present season; when the market moves, the parameters should move with it.
But re-estimation is not a cure-all. Put automatic window selection on seasonal ratio as well and it starts chasing the rally and selling the dip: whoever was accurate recently gets copied, and 19.0% falls to 23.3%.
Its "growth rate over the last three months" is a method definition, not a knob. Some things are meant to be fixed tight.
Can you afford to be wrong?
Back to 2019. The people writing NIO off were not using bad models. Losses, share price, deliveries — every one of them had evidence.
They lost on the assumption — that next year would look like this year.
But in business, "not like" is the normal state. New products, policy changes, new competitors — that curve multiplied fifteen times in six years on things no model could see. In November 2025 William Li himself said the impact of expiring subsidies "was unforeseen by the industry". A turning point the company could not foresee is even less foreseeable by a model.
So do not read that 16.3% as the model failing. It is not a limit. It is the variability of this curve itself — you can approach it, you cannot kill it.
The real divide is not in whether you guess right. It is in what you do when you are wrong.
Ask for a range, not a point. "Thirty thousand next month" is a promise. "Twenty-six to thirty-five thousand" is a tool. Hold safety stock to absorb the swing and flexible capacity as a fallback. Those who design "we will be wrong" into the process treat error as a cost. Those who do not treat it as an accident.
Guessing right is luck. Affording to be wrong is skill.
Twenty-odd years in supply chain, and I have not seen one winner who guessed best. Every one of them was wrong cheapest.
Back to the question: what are the steps in forecasting from historical sales data?
Not to tip the history into a model in one heap, but to do this: fix the back-test rules as your real working rules; re-estimate monthly and never peek at the future; compare single models on the same MAPE; combine only complementary ones; and finally admit that structural breaks cannot be forecast, and cover them with ranges, inventory and flexible capacity.
History can tell you what worked in the past. It cannot promise the future will repeat. Its job is to make you wrong less often and to make being wrong affordable — not to pretend you will not be wrong.